Social Graph Visualization with Babbleknot.com
This item originally ran on the babbleknot.com blog.
Babbleknot.com is now open for a public beta.
Babbleknot scans the index pages of over 70,000 message boards to generate thread / topic metrics. Things such as velocity, mass, acceleration to name a few. These metrics are used to generate input to a spider that indexes the content and generates graphs of the hot threads.
Below is a sample graph which is part of this flickr set.
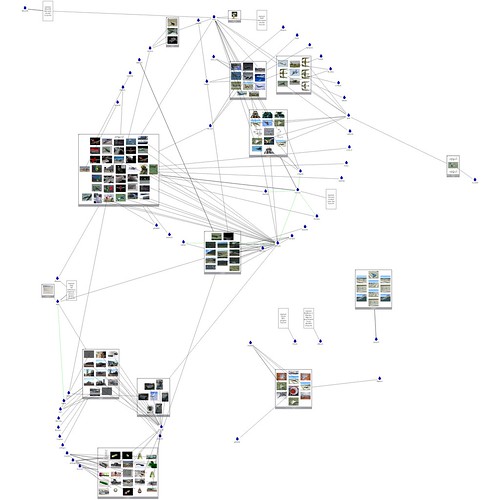
On the graph above, you see people, threads, and images, with lines representing relationships between objects with a "circular" layout.
Graphs? Why? The graphs provide a top-down view of the content, people and their relationships. You can see 10s, 100s of threads & topics at once. More coming hopefully as we learn to scale. In the future you'll also be able to generate graphs that span boards & forums. The best part of these graphs are that they aren't just static images. You can zoom & pan (screencam), and all the embedded content images are wrapped in a lightbox for easy display and perusal. You have quick access to the thread & user profiles with links representing post responsibility and direct quoting. More coming.
Privacy? Yep, there will be complaints. I expect some push back. I'll be happy to pull any board that doesn't want to be indexed. We'll be respecting robots.txt soon to make that easy.
What else is coming? Identity claiming so you can link your babbleknot.com identity to individual board identities, and delve deeper into your own social graph. Tagging of all kinds is 99% complete & will be on the home page soon. Full content indexing, thread tracking, alerts, content recognition beyond images, more board types, and maybe even posting capability.
Watch this blog for more information and give babbleknot.com a try today.
Babbleknot.com is now open for a public beta.
Babbleknot scans the index pages of over 70,000 message boards to generate thread / topic metrics. Things such as velocity, mass, acceleration to name a few. These metrics are used to generate input to a spider that indexes the content and generates graphs of the hot threads.
Below is a sample graph which is part of this flickr set.
On the graph above, you see people, threads, and images, with lines representing relationships between objects with a "circular" layout.
Graphs? Why? The graphs provide a top-down view of the content, people and their relationships. You can see 10s, 100s of threads & topics at once. More coming hopefully as we learn to scale. In the future you'll also be able to generate graphs that span boards & forums. The best part of these graphs are that they aren't just static images. You can zoom & pan (screencam), and all the embedded content images are wrapped in a lightbox for easy display and perusal. You have quick access to the thread & user profiles with links representing post responsibility and direct quoting. More coming.
Privacy? Yep, there will be complaints. I expect some push back. I'll be happy to pull any board that doesn't want to be indexed. We'll be respecting robots.txt soon to make that easy.
What else is coming? Identity claiming so you can link your babbleknot.com identity to individual board identities, and delve deeper into your own social graph. Tagging of all kinds is 99% complete & will be on the home page soon. Full content indexing, thread tracking, alerts, content recognition beyond images, more board types, and maybe even posting capability.
Watch this blog for more information and give babbleknot.com a try today.
posted by Billy Bob Bain at 4:56 PM
![]()
![]()

0 Comments:
Post a Comment
<< Home